

Quadrants

| Changes the view to a Customer Quadrant view. Click again to return to the default grid showing Salesman by Period.
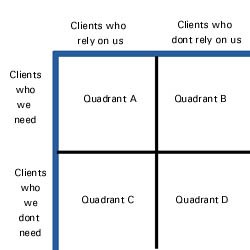
Customer Quadrants are a key analysis tool in Salesmatrix enabling understanding of trends and planning of future strategies in the customer dimension. The term 'Quadrant' stems from the classic customer management methodology that analyzes the quality of customers in a business. For example, the following simple quadrant diagram demonstrates the available strategies a business has to improve its market share.
Quadrant A in this example should contain the core customers who drive the current business and should be the focus of marketing attention. To improve, or grow, the business in this quadrant poses the following options: (A) Does the business plan attempt to move customers from quadrant B to quadrant A by providing products and services that will make them more reliant on the business? or (B) Does it attempt to convert smaller or unprofitable customers currently in quadrants C and D into more important customers? Creating QuadrantsAttached to the customer sector of the data there are five independent categories that can be used to display ten different quadrant views. Quadrant views are simply Customers (Category n) by Customers (Category m). It follows that creating and manipulating Customers and their categories are important to these views. Customer categories can be created in three methods: (1) Imported directly from your practice management data. (2) Created using the assessment tool. (3) Manually created using the category screen or the customer data form. Values able to be viewed with Customers Quadrant view on.In addition to the standard values able to be shown in the grid (i.e. Revenue, Units, Margin etc.), the Customers quadrant view will also allow the following values to be displayed:
|