Performing Traffic Lighting
Traffic Lights quickly highlight variations in sales performance within a single grid.
NOTE:
- It should be used as a guide only.
- It is intended only to highlight relative performance, not to delineate 'good' or 'bad' performances.
- It is dependent on the quantity, quality and type of data shown in each grid.
However, it is a valuable aid for highlighting comparatively unusual figures, especially in large data sets.
When the Traffic lights are turned on, an adjustor shows in the toolbar that changes the standard deviation level used by the traffic light calculations.

Salesmatrix can change the standard deviation level that is used by the traffic lights. To adjust this level go to Tools/Options and click the intelligence tab. There is a slider with the Title "Std Deviation Level" with the ability to alter from 0.5 to 3.0 standard deviations.
Reading the traffic lights: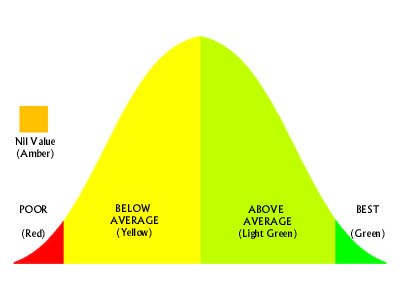
How the Traffic Lights Work
On all grids except views by period (Salesman, Products or Customers by Period), the Traffic Lights are calculated per column (from top to bottom). On "by period" views, the Traffic Lights calculate per row (from right to left). This displays good monthly results compared to poor monthly results for the same item.
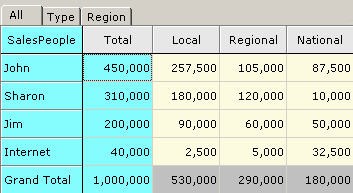
Without Traffic Lights
With Traffic Lights
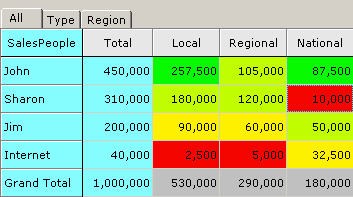
Even in a simple grid, Traffic Lights highlight opportunities and potential issues. For example, as a Salesperson, John is performing extremely well on a Local and National basis, but not to the same level on a Regional basis. Sharon, while performing above average on a local and regional base, is not performing the same at a National level.
|