


Reshape and Inflate
Below the what-if grid, Monthly adjustments controls how the annual total is spread across the 12 months. Leave both options unticked to use the automatic seasonal curve with no inflation — which is what most first budgets want.
Customise the monthly distribution
Ticking this reflows the annual total across months without changing the total. Choose what to base the shape on:
- Even — every month gets the same share.
- Working days — months are weighted by trading days. A Busy-day threshold (line items per day) decides which days count as trading, so quiet days do not inflate a month's weight.
The per-month table can then be edited directly:
| Column | What it does |
|---|---|
| Working days | Trading days counted for that month, when using the working-days basis. |
| Monthly % | That month's share of the annual total. Edit to reshape by hand. |
| Revenue × | Multiplier applied to that month's revenue. |
| Cost × | Multiplier applied to that month's cost. |
Reset returns the table to the chosen basis if you want to start again.
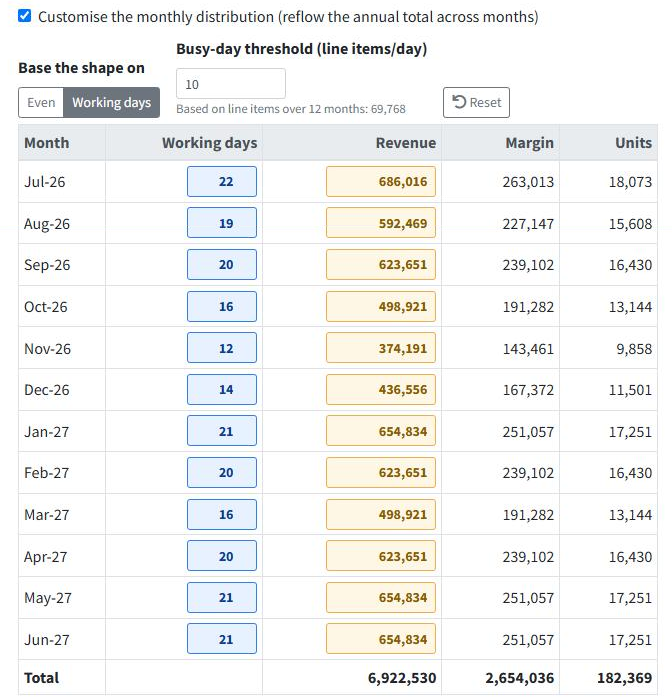 Distribution based on working days: quieter months carry a smaller share of the year.
Apply monthly inflation
Ticking this compounds a monthly increase through the year rather than applying a flat uplift. Revenue inflation is taken from the Sale Price Change % and cost inflation from the Cost Price Change %, compounded each month so the rate is reached by year-end. Cost follows the same monthly pattern as revenue.
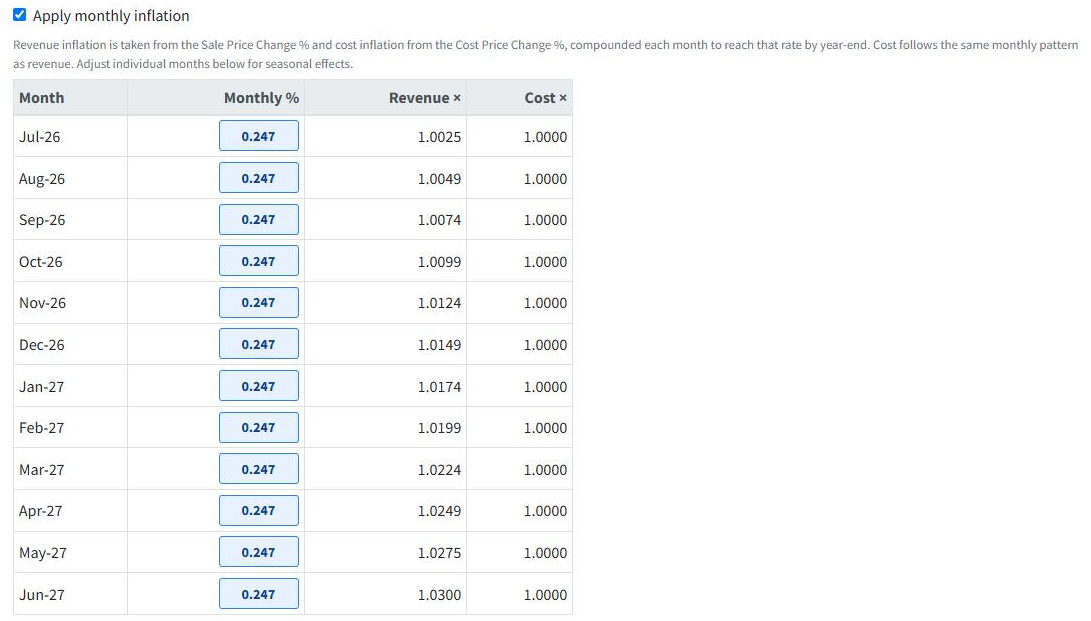 A 3% sale-price change compounded month by month to reach 3% by year-end.
The two work together
Distribution decides how much lands in each month; inflation decides how the rate builds across them. You can use either alone, or both — adjust individual months in the table afterwards to allow for seasonal effects.