

Opportunity Navigator

|
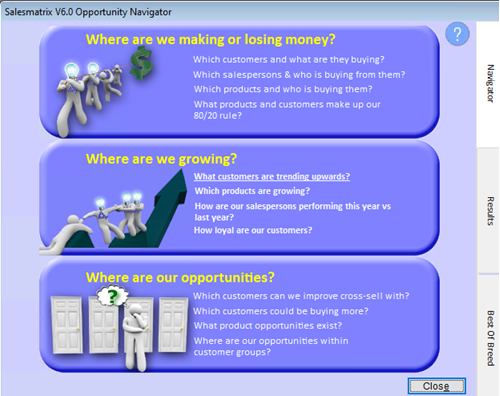
The Opportunity Navigator is the hub of Salesmatrix.
It gives an easy way to access key results within Salesmatrix as well as an overall summary of your data results in Salesmatrix. The Dashboard should be the starting point of your analysis of sales data or projections. There are three key sections:
NavigatorThis interface provides a practical way to let Salesmatrix guide you through the day-to-day questions that will enable you to drive your market more intelligently. Most questions take you through an assessment wizard, and then leave you with a results grid that you can analyse for patterns and issues. The 4th question takes the user directly to the 80/20 focus interface, while questions 11 and 12 provide interfaces into the product and customer CRM interface tool that are not available elsewhere in Salesmatrix. ResultsResults gives a summary of four key performance measures - the total Revenue, total Margin, the total Units and the Margin percentage. By default, the screen shows the totals for the 12 month periods. By altering the dropdown lists, the performance of individual monthly periods can be analysed. In a similar manner to traffic lights in the main grid, the colour of the circle at the right of each row indicates the relative performance of each of the performance measures.
|
This measures the number of individual Products, Customers, and Salespersons which were active in the data set. It also shows the number of transactions analysed for the chosen period.
Although these activity measures display the same 'traffic light' measures as for the results section (increase is better), an increase in the volume of business activity may not necessarily be construed as positive. As per the focus screen, a business manager may set an objective of reducing an aspect of the business in order to achieve better efficiency.
Key Performance Indicators
- Per SalesPerson Revenue Total Revenue / Number of Salespersons
- Products per Customer The average cross-sell value during the period i.e. the average number of distinct products a customer purchased.
- Customers per SalesPerson The average number of distinct customers that each salesperson sold to in the period.
- Products per SalesPerson The average number of distinct products that each salesperson sold to in the period.
- Market White Space An indicator of our cross-sell performance
100 - ((Sum of total distinct Products sold to each Customer)/No. of Products x No. of Customers.) - Customers 80% Focus The number of our customers (when ranked largest to smallest) who made up 80% of sales for the period.
- Products 80% Focus The number of products (when ranked largest to smallest) which made up 80% of sales for the period.
Best of Breed
Based on the period chosen in the left-hand column of Results, this lists the top ten performers in Customers, Products or Salespersons, by either Revenue, Margin or Units.