
Row and Column Charts
|
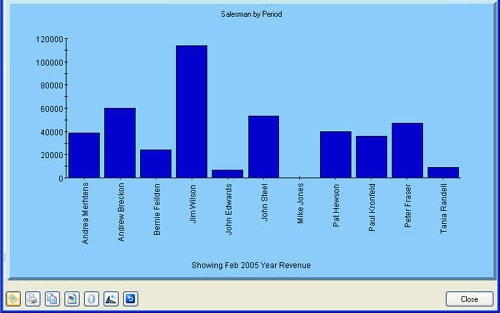
Displays a chart view of the current row or column data in the main grid.
A graph based on the default chart style is displayed, showing all values in the current row or column.
The presentation of the graph can be changed to suit your needs. The buttons in the bottom toolbar provide the following features:
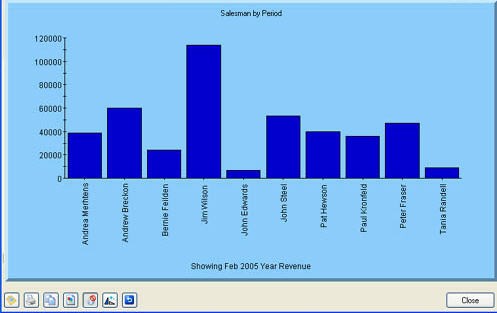
Because rows and columns may display many zero values, the button Show/Hide Zero Values in the bottom toolbar is included to get rid of the zero values in the series of data displayed.
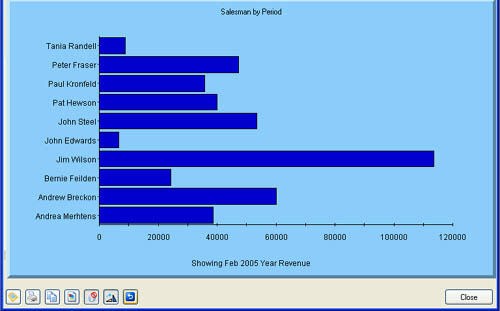
It may be more appropriate for a range of data to be displayed horizontally. The button Rotate Graph Axis is included to enable this.
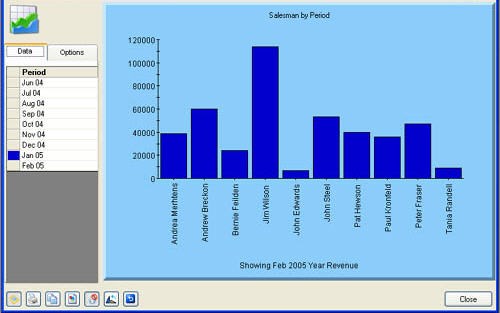
The Graph Options button displays a Sidebar area where the contents of the current graph can be modified. Advanced Graph Options can be used to access some of the more powerful and complex graph viewing features.
Default graph settings are stored in the file: [Application Path]default.oc2. Use Graph Save in the Graph Options tab to set and restore default settings. |