Salesmatrix simplifies the creation of Budgets and Projections from the datasets. Put in basic terms, Salesmatrix creates four-dimensional budgets that allow, for example, a Salesperson to see the mix of Customers and Products they are expected to sell based on the budget parameters entered.
- Step 1 - The Base Data

Clicking on the Budget Toolbar Icon will present the budget creation wizard. The top section of the Drivers page shows the basic values that have been transferred from the dataset.
- Step 2 - Making Adjustments
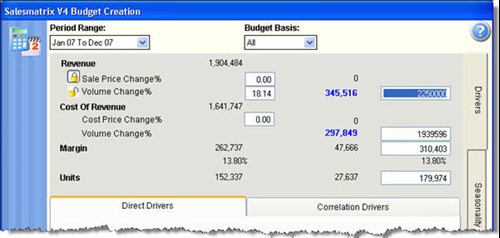
The entry areas in white can all be entered manually to alter the projected values, and the affected values will change throughout the worksheet.
- Step 3 - Specifying Price change versus Volume change.
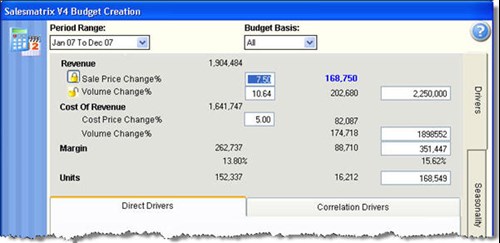
Revenue changes can be assigned to either Volume or Sales Price Changes. A locked or unlocked padlock signifies which value will be affected by the flow-through of other worksheet changes. The percentage values can be overwritten directly and the results will flow through to the affected values.
- Step 4 - Correlation Drivers
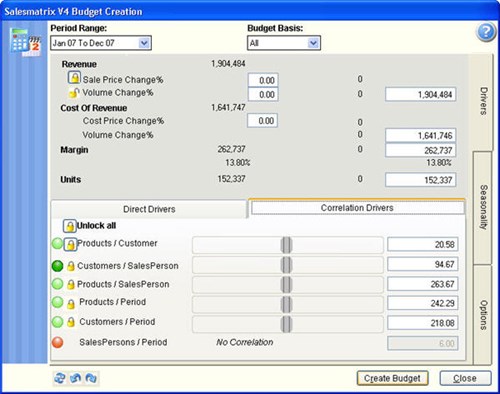
This sub-page looks at key relationships within the dataset and calculates whether there is a correlation between
monthly sales results and the driver. For example: how many Customers does a salesperson sell to each month or how many Product types are sold each period? The significance of the relationship is denoted by a coloured traffic-light.
A green traffic light signals a strong relationship, light green less significant. If the traffic light is red (a very weak correlation) the value is disabled from the drivers.
- Step 5 - Modifying Correlation drivers
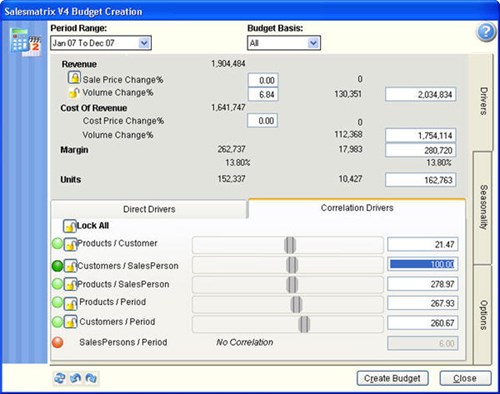
Let's say we set a target of 100 customers per month to be sold to by each Salesperson, compared to the average of 94.67 from the base dataset. Keying that figure in will show the calculated regression effect of that increase - a 6.84% percent or 130351 increase in Revenue.
- Step 6 - Reviewing the Seasonality
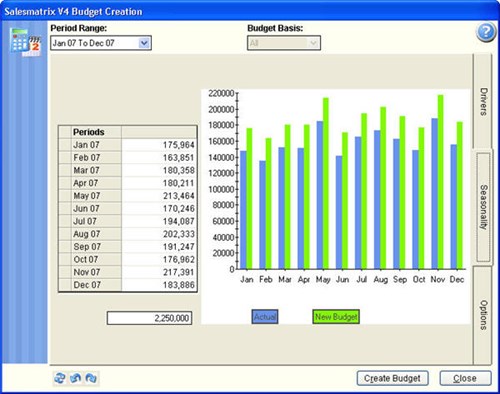
The Seasonality page shows graphically the spread of this year versus the projected year.
- Step 7 - Altering the Seasonality
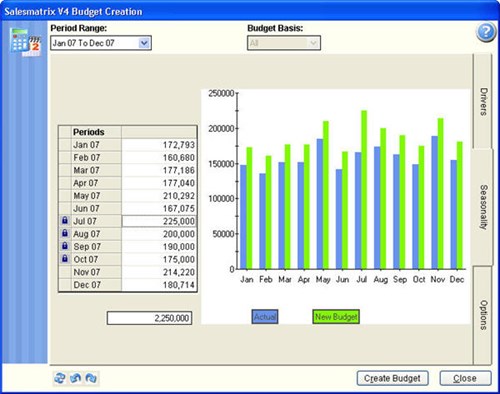
The monthly values can all be altered and the resulting values respread over the unlocked periods. as a value is altered in the grid, a lock will show alongside the value. This lock can subsequently be released by clicking on it.
- Step 8 - Budget Creation options
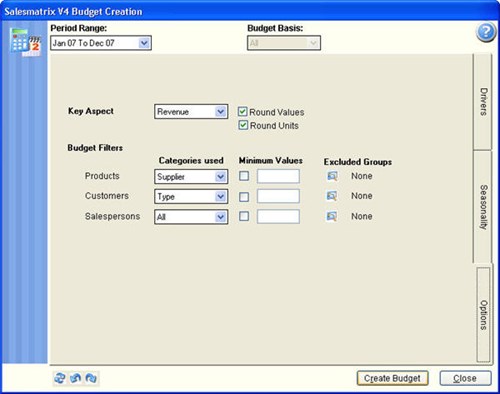
The Options page affects details on how the resulting budget will be formed. The resulting values can be rounded
by value or unit, and whether the key aspects are filtered by categories. It is suggested that at least two of the three
aspects are reduced to categories, so that the size and significance of the resulting budget are kept to a reasonable size.
- Step 9 - Reviewing the resulting budget.
Clicking the 'Create Budget' will prompt you for a name to identify the newly created budget.
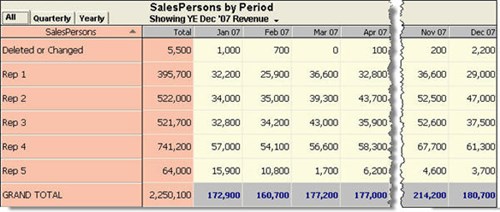
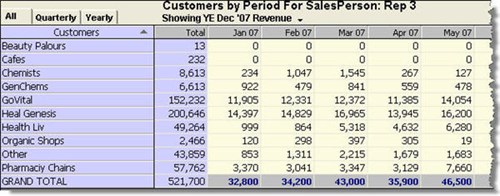
Opening the Budget Dataset will show the results in the normal Salesmatrix format.
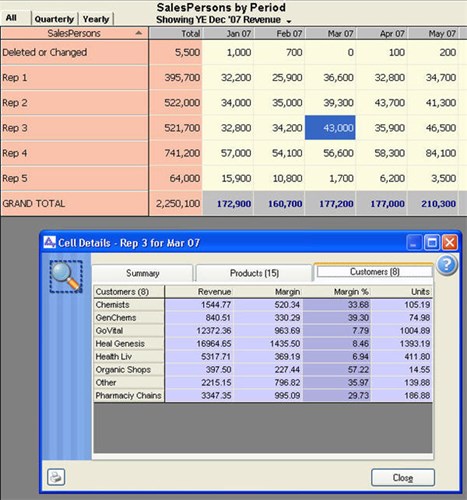
Double-clicking on a cell will show the values behind the results - for example the customer and product mix for a particular monthly Salespersons budget.
- Step 11 - Giving the Salespeople their targets
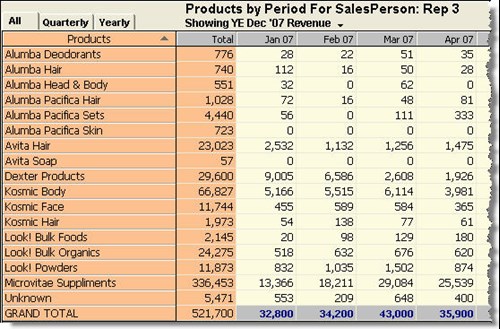
By using the Salesperson filters in the sidebar you can instantly show monthly budgets for each of your Sales team by Product or by Customer category.