|

Creating Charts
Show/Hide Graph Options
|
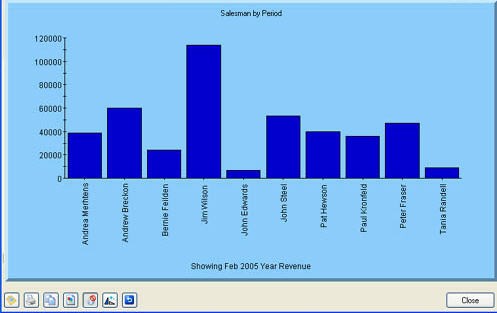
The Graph Options button displays a Sidebar area where the contents of the current graph can be modified. The Sidebar can be dragged right to enlarge or left to reduce. It consists of two tabs, Data and Options. This feature is available for Row and Column Graphs.
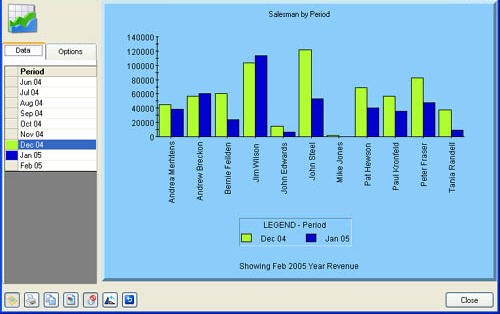
Data tab
The Data tab allows the graph to display and compare surrounding data rows or columns. Up to 7 surrounding rows or columns can be displayed on a chart. Simply clicking on a row in the list displayed will include that data series, or turn off the display if that series is already displayed.
Options tab
The Options tab configures many of the common settings that can modify the layout and display of the graph.
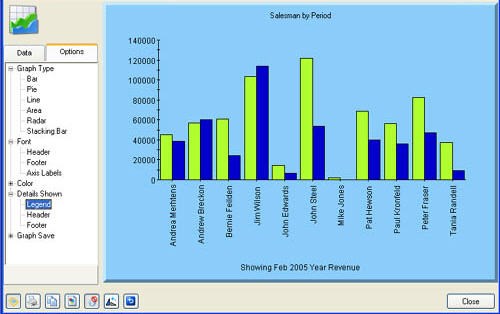
Graph Type: Changes the type of graph displayed to several popular formats including Pie, Line and Stacking Bar.
Font: Allows modification of the Font, Font style and Size in the Graph Header, Footer and Axis Labels
Colour: Enables colour modifications to the foreground and background of all Graph areas for the current chart. There is a hierarchy of colour:
- Graph Area will change all the background.
- Chart Area will change the plot area and the axis with their labels.
- Plot Area will change the plot area inside the axis.
- Header will change the header. Further changes to the Graph Area will not change the Header.
- Footer will change the footer details. Further changes to the Graph Area will not change the Footer.
- Legend will change the legend details. Further changes to the Graph Area will not change the Legend.
Details shown: Enables the inclusion or exclusion of the Legend, Header or Footer from the graph.
Graph Save: provides options to save and load the graph and its settings.
- Save Graph enables the graph and its setting to be saved to a native format file (.oc2) for future use. Note that this allows the current graph settings to be saved so that future graphs will display the current settings.
- Load Graph enables the loading and viewing of a previously saved graph.

Default graph settings are stored in the file: [Application Path]Default.oc2. Use:
- Load Graph in the Options tab and select the file Default.oc2 to restore default settings.
- Save Graph in the Options tab and save the file Default.oc2 to permanently change the default settings to suit your business needs.

Further modifications can be made to the look of the chart in the Advanced Graph Options.
|