|
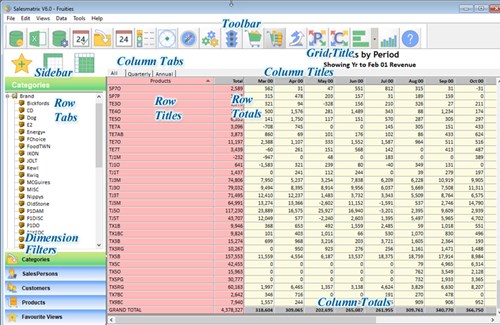
The grid is the main information source for Salesmatrix.
It provides a dynamic environment where sales performance results can be compared and analysed.
Toolbar
Actions:
Clicking each button has a particular task or function. See Toolbar.
Can also be hidden via the menu item "Hide Toolbar"
Sidebar
Controls Four tabs, 'Categories' and the three key aspects of the Salesmatrix equation i.e. 'Salespersons'/'Customers'/'Products'
Actions:
In Customer by Product, and Product or Customer by Period views, choosing one Salesperson will show only the Customers and Products sold by that Salesperson.
Row Titles
Double-clicking on any of the single items will pop-up an analysis report detailing the revenue, margin and performance KPIs of the Product, Customer or Salesperson for the past 12 months. This is especially good for understanding whether this business component is performing well or whether there have been issues over the past year.
Clicking the Intelligence tab will further provide insight into the performance and practical areas where improvement can be made.
Dimension Filters
Opens up tabs to allow the choice of one item to filter by. For example all Products purchased by one customer, or one salesperson's customers or one product's customers can all be viewed.
Column Tabs and Row Tabs
"Category" mode
Contains the list of independent categories and subsequent breakdowns for the vertical axis.
Actions:
Clicking one of the folders displays the individual terms in that category. You can click on any category or item under a category to narrow your data set. In the default settings "Detailed" rows appear as cream, while "Total" (summarised) rows appear grey with total in the title.
"Salespersons/Customer/Product" mode
Contains a list of each of the members of the respective aspect.
Actions:
Clicking on a Salesperson from the nodes on the sidebar tree filters the grid, reveals details only pertaining to the selected Salesperson. The same goes for each of the other two aspects.
This is especially powerful for viewing what Products each customer has purchased, or which Customers have purchased a particular product.
Grid Title
Gives a full description of the data displayed in the grid.
Column Titles
Actions:
Clicking a column header will sort the column from the lowest to the highest. A subsequent click will reverse the sort order
Row Totals
Actions:
Double-Clicking the description area will sort the row from the lowest column to highest column. This also works for Total columns. A small information dialogue may appear while the sorting is completed.
Data Cells
Actions:
Double-clicking a data cell will "drill-down" into the details behind the cell and open the Matrix Details window
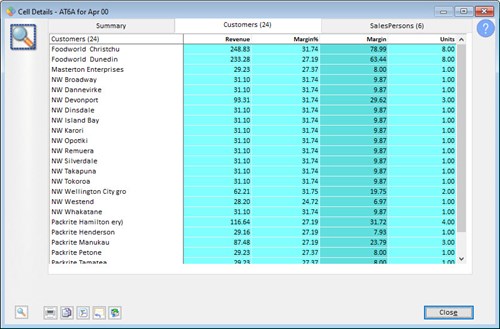
Depending on the grid that is drilled-down into, this screen may show a number of tabs displaying information about the cell. The first tab displays a summary of the key details of the transactions. The remaining tabs display the other aspects of the cell. For example, if the display is Salesperson by Period, the Matrix Details will display the Products sold and Customers sold to for that cell. Similarly, if the display is Products by Customers, the Matrix details will show the periods the transactions fell into, and the Salespersons responsible for the sale.
The quadrants view drill-down will display all four aspects of the data displayed including the clients that fall within that quadrant cell.
The Revenue, Margin and Units display can be sorted in ascending or descending order by clicking on the titles of these columns.
Right-clicking on a cell will display a menu enabling access to the key functionality of Salesmatrix
The Copy button  in the bottom left allows the contents of the grid to be transferred to other software packages (e.g. MS Excel/Word etc.) in the bottom left allows the contents of the grid to be transferred to other software packages (e.g. MS Excel/Word etc.)
|