


4. Anatomy of a widget
Every tile on the dashboard is a widget showing one thing: a headline figure, a ranked list, a chart, a small report, or a set of shortcuts. They all share the same header.
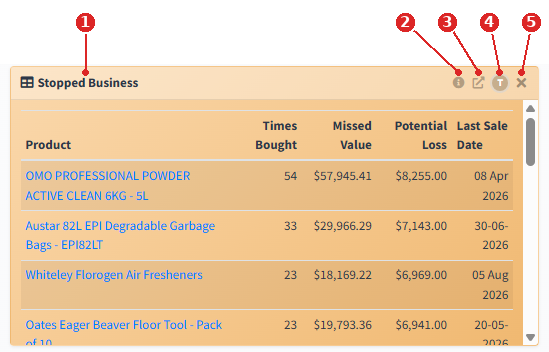
| Header control | What it does |
|---|---|
| Title | What the widget shows. Hold and drag here to move the widget. |
| ⓘ Info | A short explanation of the figures and where they come from. |
| Open report | Opens the full report behind the widget, for the detail it cannot fit. |
| SWOT badge | Colours the widget as a Strength, Weakness, Opportunity, Threat, Neutral or Comparison. Click to change. |
| Personal / Company | On widgets that support it, switches between your own patch and the whole business. See page 9. |
| × Remove | Takes the widget off the board. |
Colour-coding the board
The SWOT badge is how a dashboard tells a story at a glance. Set each widget to what it means for the business — a Threat for Stopped Business, a Strength for Business Increases, an Opportunity for Lapsed Products — and the colours on the board read before the numbers do. Neutral suits reference widgets such as Quick Links; Comparison suits the year-on-year widgets.