


8. Drilling into a figure
There are two ways to go deeper, both by double-clicking.
Open a category into its members
When the rows are a category — Customer – Region, say — double-click a row's label to replace the grid with the customers inside that region. A banner names the group you are in; Back to groups returns.
Cell Details: what is behind one number
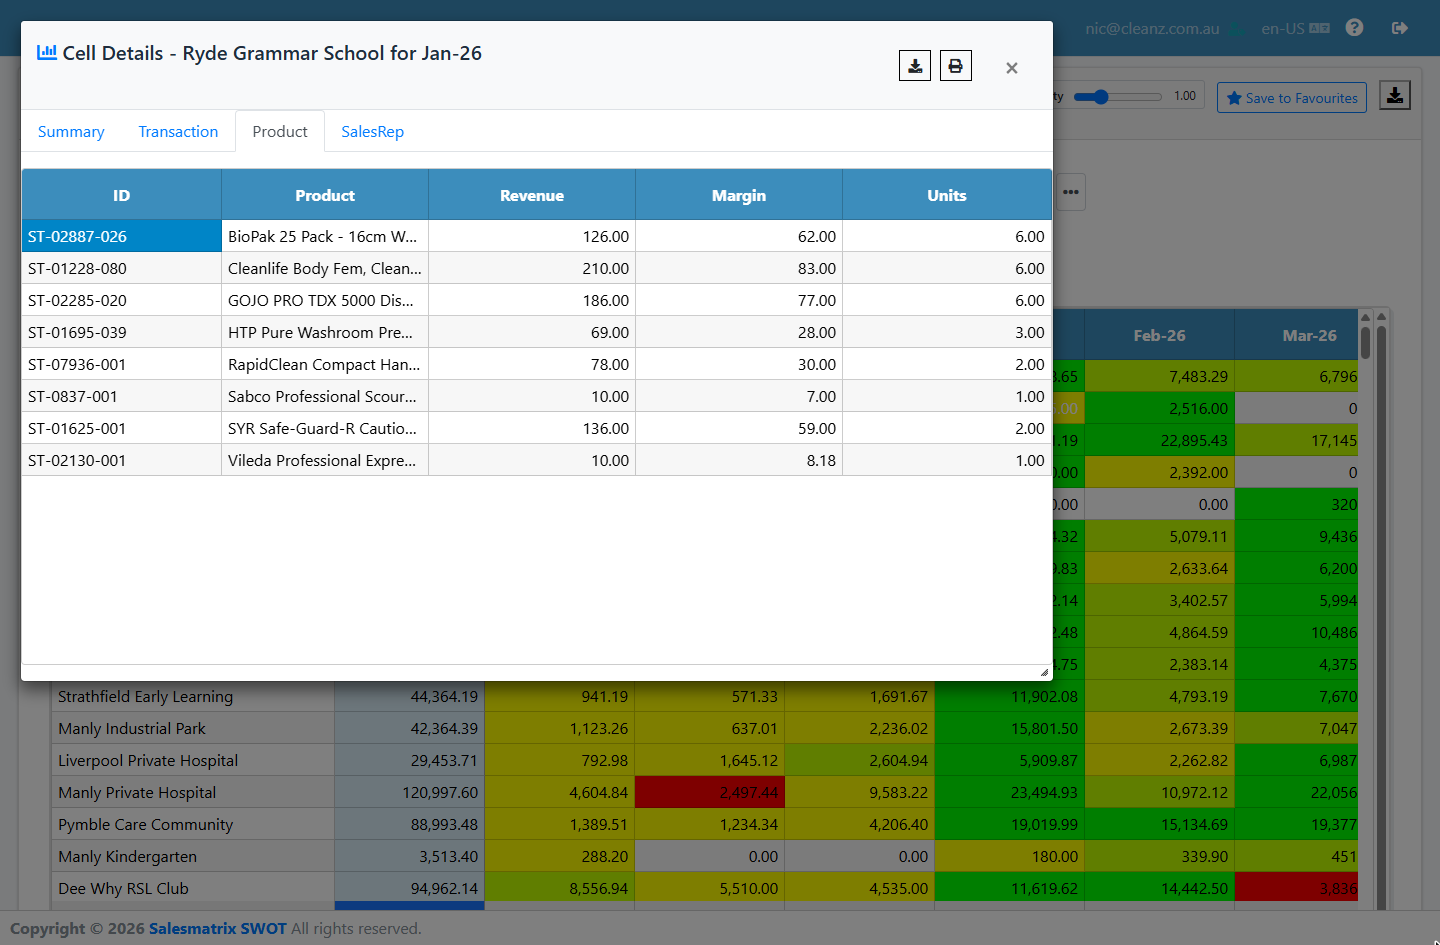
Double-click any cell holding a figure to open Cell Details. It starts with summary metrics for that cell alone — transactions, units, margin, margin % and margin per unit — with Add metrics for more. Beneath are two tabs that split the same figure by the two dimensions the grid is not showing:
| Grid on screen | First tab | Second tab |
|---|---|---|
| Customer by Period | Product | SalesRep |
| Customer by Product | SalesRep | Period |
| Product by Salesman | Customer | Period |
Open a group in either tab to see the individual transactions behind it, and Back to groups to return. The download and print icons in the popup's header export just what it is showing, to Excel or PDF.
Drag its title bar to move it and any edge to resize it; the table inside grows with it. Its position and size are remembered in this browser for about a month.