


7. Reading the grid and traffic lights
- Sort by clicking any column heading; click again to reverse.
- The row labels and the headings stay in place as you scroll a large grid.
- A blank cell means there were no transactions for that combination.
Traffic lights
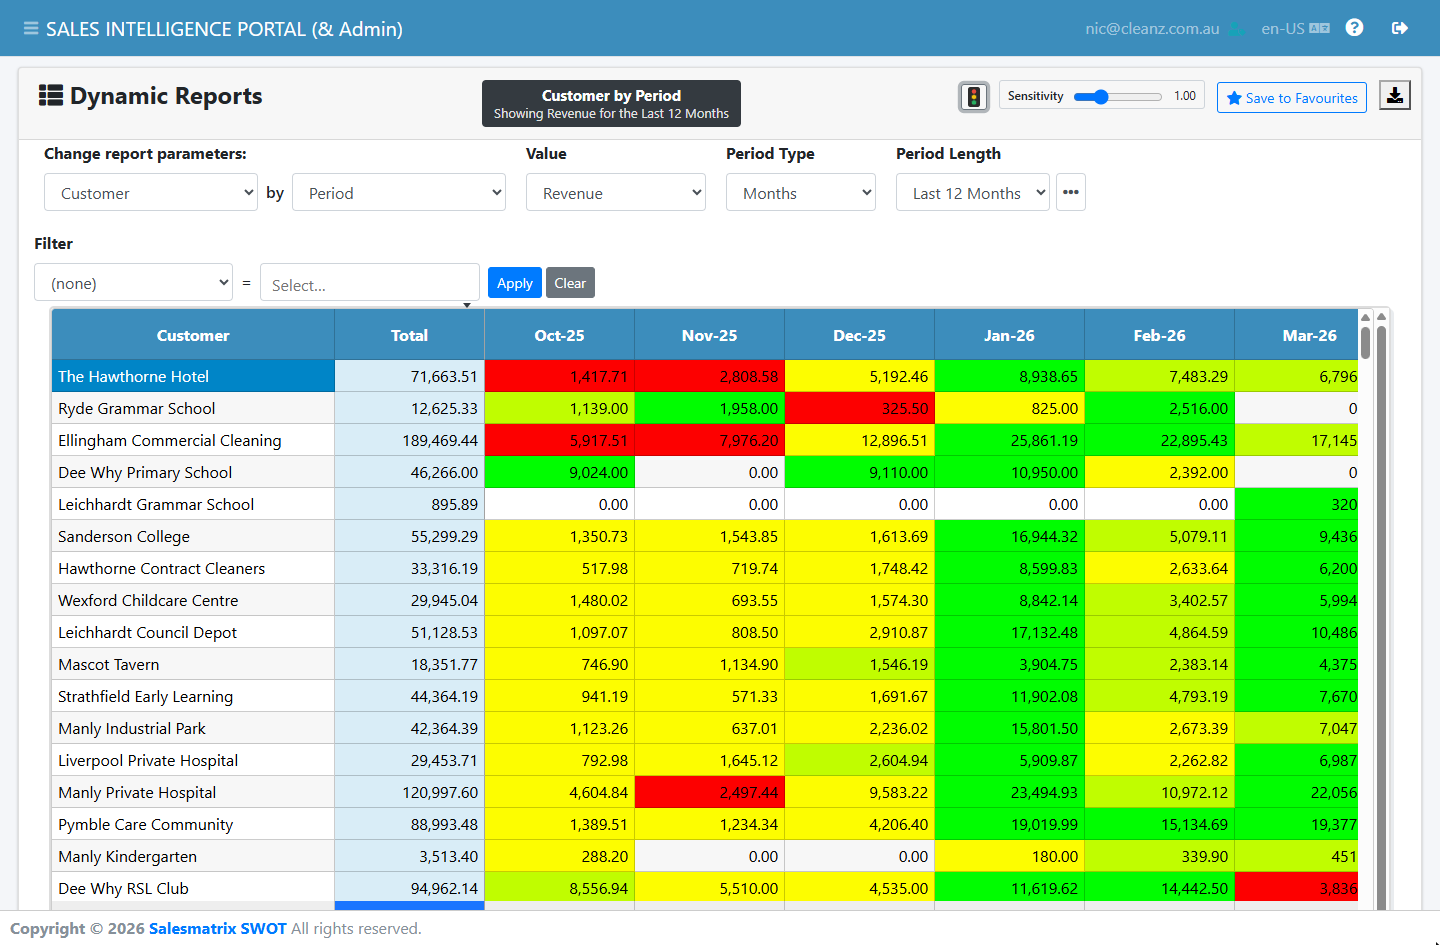
The traffic-light button at the top right shades each cell by how far it sits from the average of its own row — green well above, red well below. An unusually strong or weak month for a customer jumps out without reading a single number.
Turning the lights on reveals a Sensitivity slider. It is measured in standard deviations: drag it right to highlight fewer, more extreme cells, and left to highlight more. Your setting is remembered in this browser.
Where the starting sensitivity comes from
An administrator sets the organisation's starting value on the Variables page. Moving the slider changes it only for you, in this browser.